Modelled six times before it touched a tank.
Every moving piece on this page is a component from the product, running its own model. Press “Show the seams” to see where each one came from.
The vat explainer we wrote the proposal with
Acidity follows a logistic law. The harvest day is an inversion, not a guess.
Where the heat goes
At production scale the core cooks while the shell reads healthy. Mixing saves the core, not the jacket.
An alcoholic-ferment twin with real interventions
Comparative questions are answerable before a constant is fitted. Absolute predictions are not.
From the screens
What the models look like, running.
Screens from our own twins and simulators, captured as they ran, plus the protovat explorer. The models stay in-house; the screens are the proof.
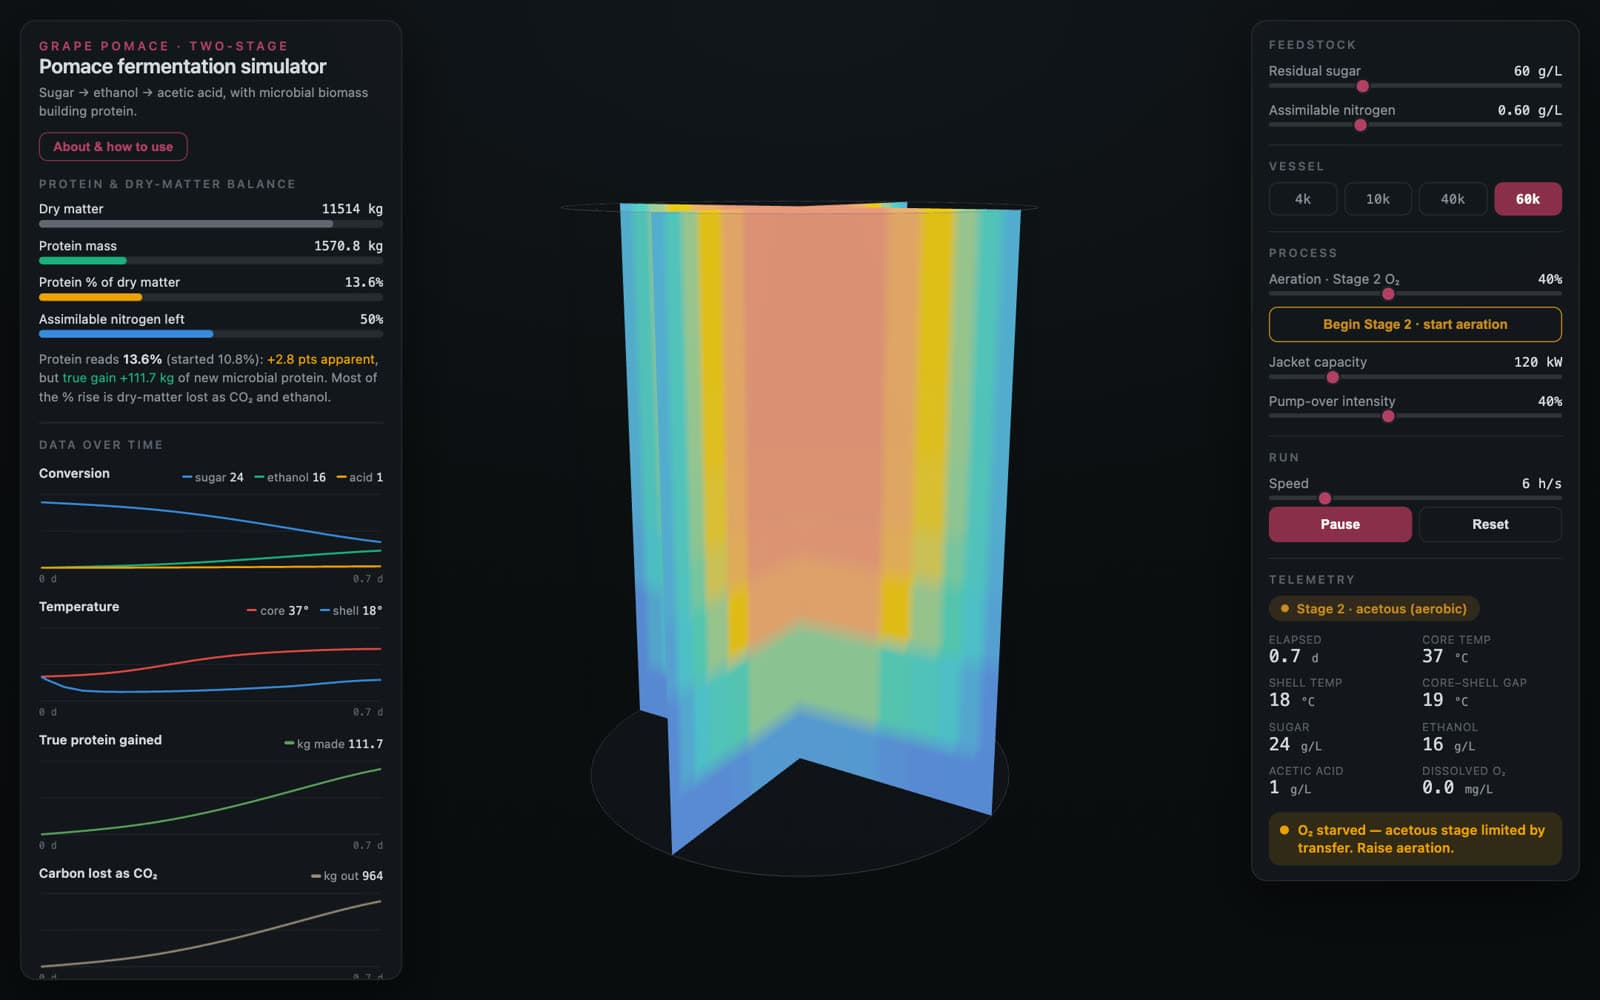
Two-stage heat & mass model
A 60,000 L tank with the pump-over off
- Two intersecting thermal slices show the core cooking while the shell, the only surface the jacket touches, still reads healthy.
- Protein and dry-matter balance on the left: true protein gained in kilograms against the percentage that merely concentrates.
- Vessel size, aeration, jacket capacity and pump-over are the four controls. Every curve is exported as CSV.
Screen capture · our own model · synthetic data
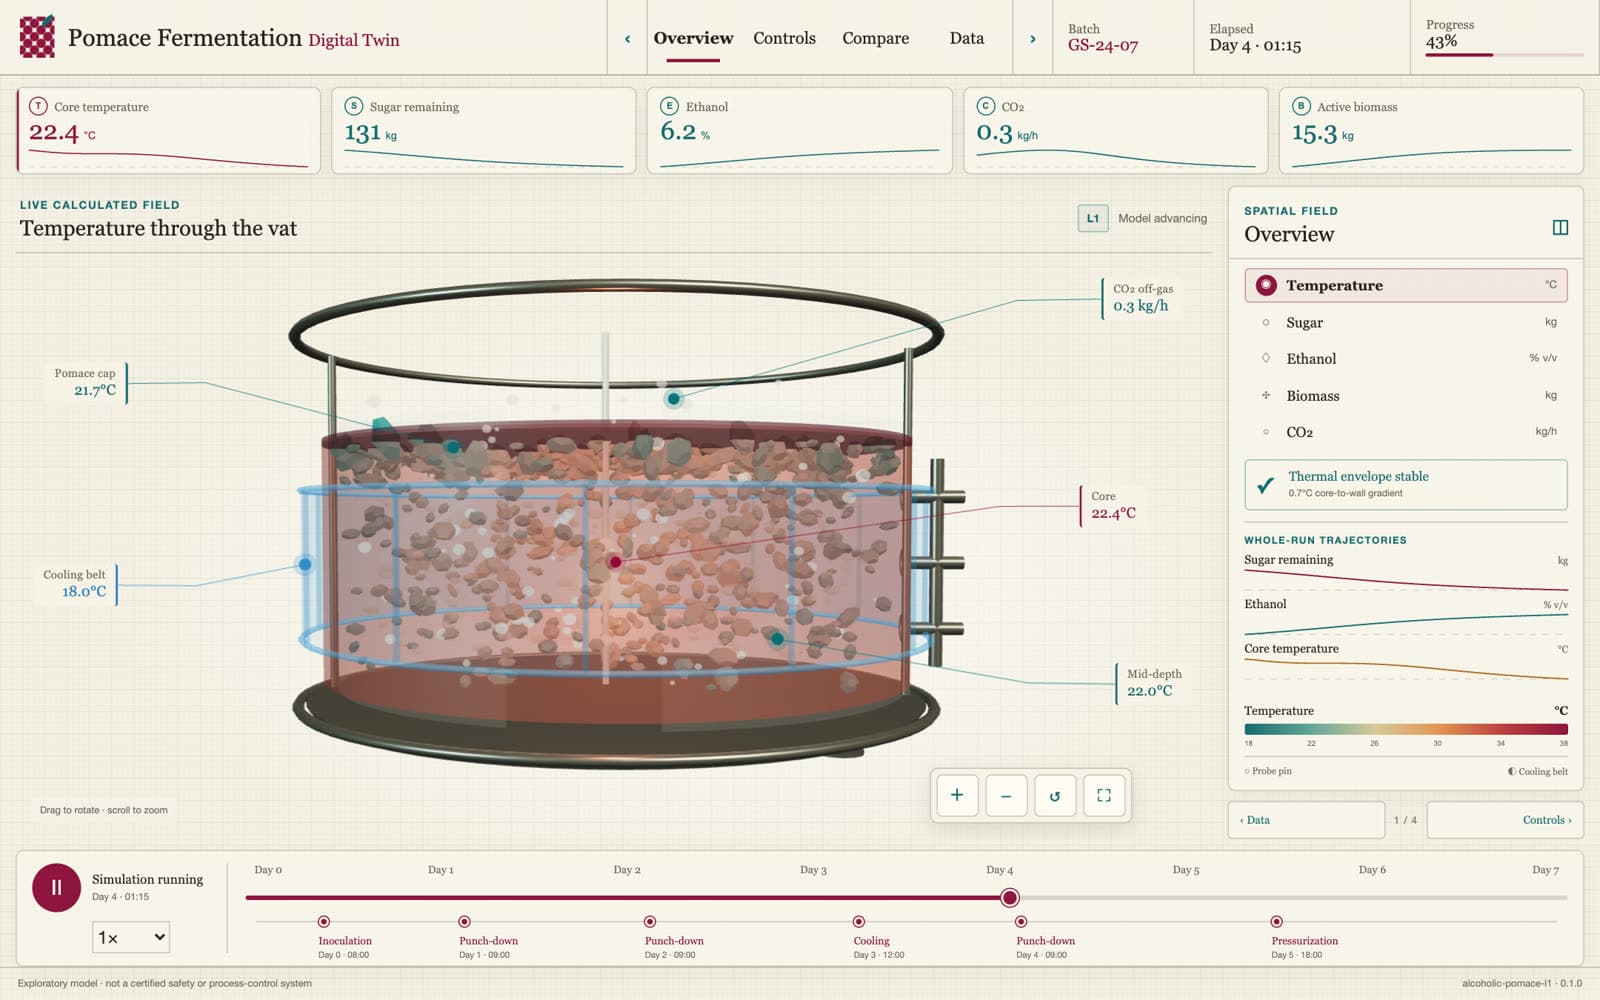
Whole-vat cutaway twin
Temperature through the vat, annotated
- A scientific cutaway with the cap, the liquid and the cooling belt each labelled with its own temperature.
- Whole-run trajectories for sugar, ethanol, biomass and core temperature beside the vat, with a thermal-envelope check.
- A timeline along the bottom carries the interventions: punch-downs, racking, cooling changes.
Screen capture · our own model · synthetic data
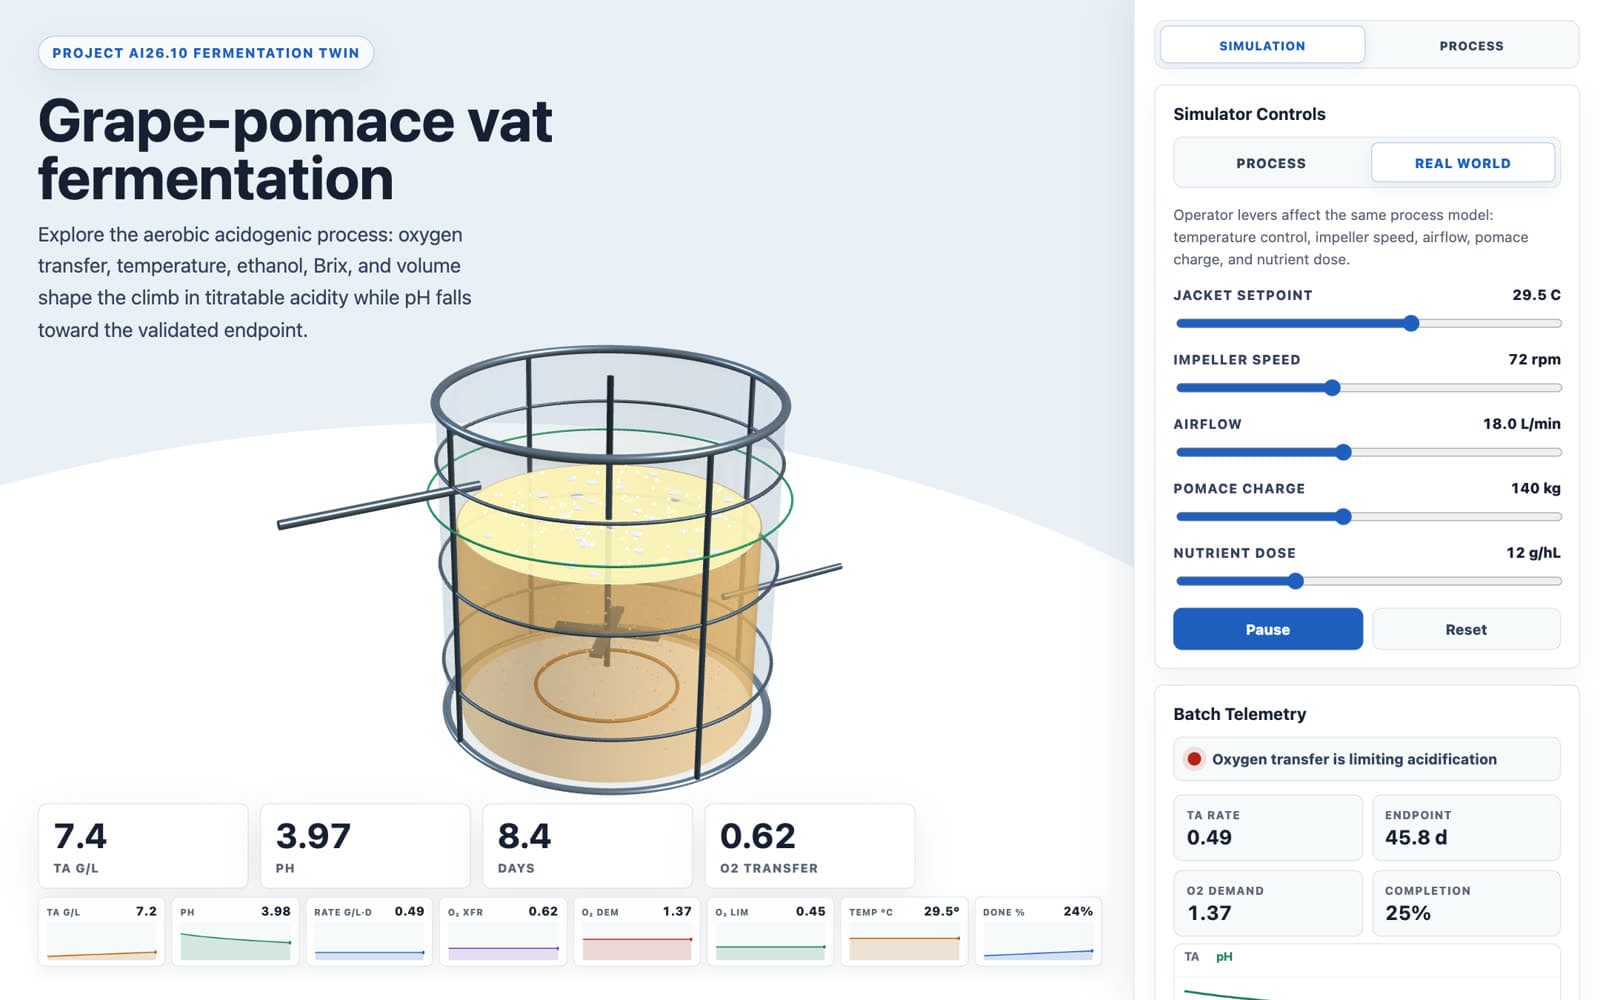
Vat explainer
Five levers, four gauges, one harvest-day estimate
- Jacket setpoint, impeller speed, airflow, pomace charge and nutrient dose drive a fed-batch model.
- Acidity, pH, elapsed days and oxygen transfer update live, with the endpoint day inverted from the target.
- Batch telemetry names the limiting factor, usually oxygen transfer.
Screen capture · our own model · synthetic data
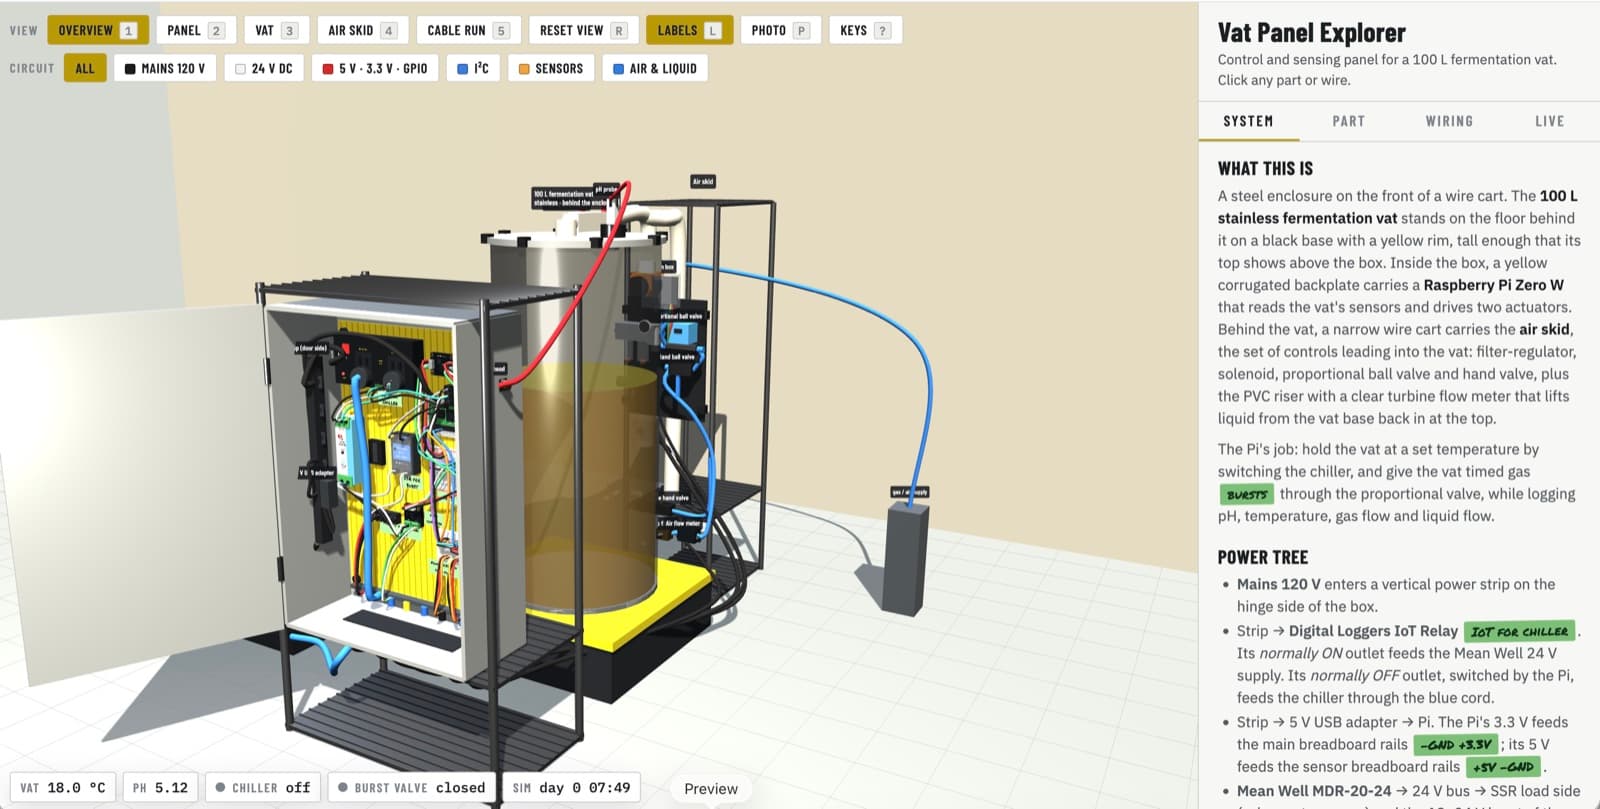
Protovat explorer
The 100 L protovat, part by part
- A three.js model of the rig, read from the photos: the panel enclosure on its cart, the 100 L vat behind it, and the air skid with the PVC riser and turbine flow meter.
- The panel: a Raspberry Pi Zero W, an EZO-pH board, a 16-bit ADC on the air-flow meter, and a 4–20 mA DAC driving the ball valve.
- The Pi holds the vat at a set temperature by switching the chiller and gives it timed gas bursts through the proportional valve, logging pH, temperature, gas flow and liquid flow.
Screen capture · protovat explorer · modelled from the real rig
Open the panel explorer ↗Built With, Not For
How the twin is being built with partners: a century of fermentation science, machine learning, and the scientists who run these processes.
- ingesttank-04 · temp 22.4 °C · pH 3.62 · DO 18 %mqtt
Now
Now: the simulators are talking to real-time data.
- 01Replay recorded batches through the model
- 02Stream live tank data
- 03Infer, check, recommend, log
- 04Close the loop on the pilot
Advisory mode first. Every prediction is versioned and logged, every recommendation passes a constraint check, and the controller earns closed-loop authority in the pilot, not on day one.